Domestic financing for nutrition
More is needed, but less is being mobilized
[Editor’s Note: This analysis on domestic spending for nutrition is a follow-up to an earlier post on donor spending for nutrition, “A wake-up call for the global nutrition community.”]
Reaching the World Health Assembly targets for nutrition by 2025 will require substantial increases in funding from domestic governments and donor agencies over 2015 levels.
The Investment Framework for Nutrition, a collaboration between the World Bank, Results for Development and 1,000 Days, estimated that $4 billion in additional domestic contributions, and $2.6 billion in additional donor contributions would be required per year over 10 years to scale up a core package of high-impact nutrition-specific interventions. Using a detailed analysis of OECD-DAC data and program documents, we recently reported that the donor community is not only missing its target for increased spending in 2016, but has actually reduced funding for that core package of interventions below 2015 levels.
Are domestic governments picking up the slack?
Domestic spending on nutrition by low and middle-income countries has historically been difficult to track over time due to a lack of complete and reliable data on nutrition expenditures. The 2018 Global Nutrition Report reported a small uptick in budget allocations for nutrition-specific programs (and larger growth for nutrition-sensitive programs), using data collated by the SUN Movement Secretariat for 25 countries. However, as many countries routinely succeed in mobilizing and spending only a portion of what has been nominally allocated, budget allocations alone say more about aspiration than about material investments in critical nutrition programs. SUN budget data are important for civil society to advocate for governments to increase their ambition level, and provide broad information across all relevant sectors for nutrition. However, in most countries, it has not yet been possible to match these allocations against actual expenditures; and some SUN countries that represent a large share of global burden of malnutrition are not yet represented with trend data from the SUN budget exercise (e.g. Nigeria and Ethiopia).
A complementary data source for nutrition-specific program expenditure is the System of Health Accounts data gathered by governments supported by WHO and other partners. This comprehensive accounting of the health sector has been ongoing in a number of countries for many years, but only more recently have some countries routinely disaggregated expenditures to combat “nutritional deficiencies” from other priorities (see technical note below for more information on this method and its limitations). This provides a new opportunity to examine trends: 29 countries have relevant data for both 2015 and 2016, while another three (Cabo Verde, Ethiopia, Tunisia) have data for 2014 and 2016 that permit extrapolation.
The picture emerging from the data reinforces the challenges the nutrition community face in reaching the World Health Assembly targets — as well as the urgent need for renewed global commitment to financing key nutrition programs.”
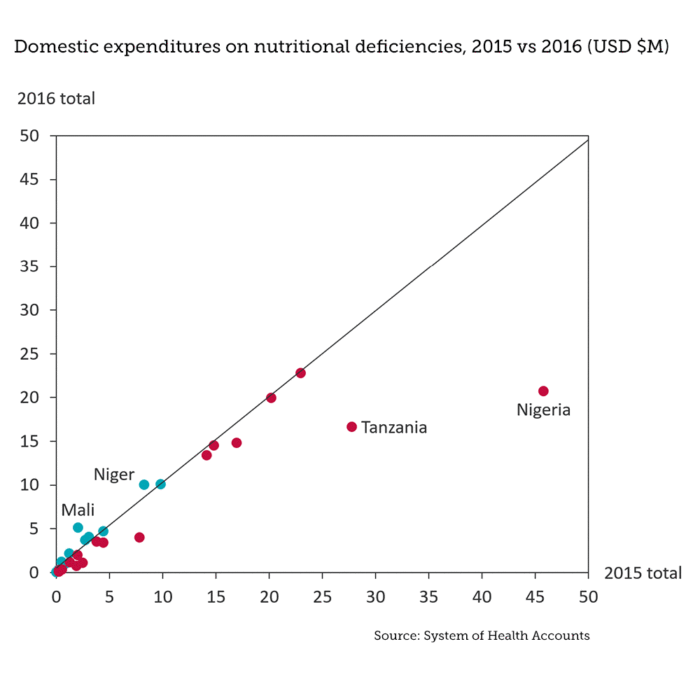
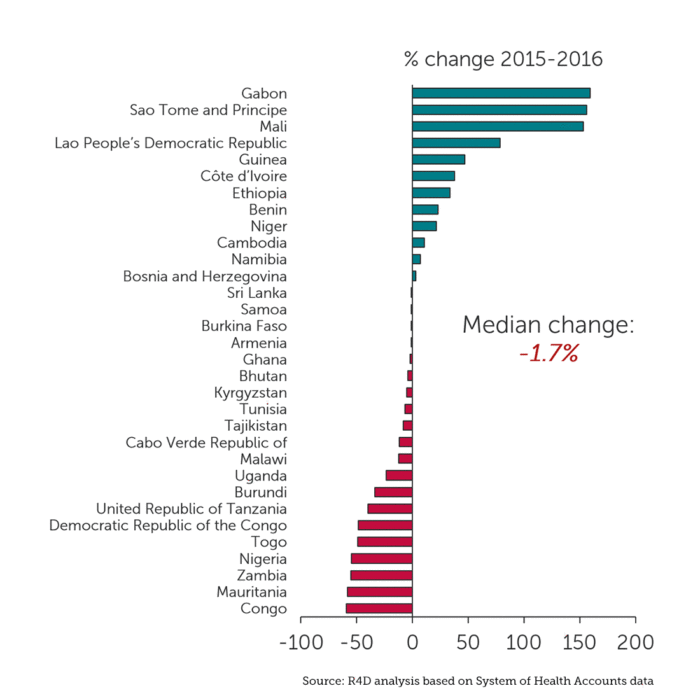
Overall, across this set of countries, spending has not risen as we might have hoped. Of the 32 countries, only 12 saw any increase in spending, shown in blue in the figure below. Four countries (Sri Lanka, Samoa, Burkina Faso and Armenia) saw a drop of less than 2 percent. The remaining 16 countries saw more substantial declines, shown in red.
In absolute terms, the story is even more negative. We estimate that total domestic spending on health programs targeted at nutritional deficiencies across these 32 countries dropped from $221 million in 2015 to $183 million in 2016 — a drop of around 17 percent. This decrease was driven by very large absolute declines in Nigeria (dropping $25 million (from $46 million to $21 million) and Tanzania (dropping from $28 million to $17 million). In Nigeria, home to 2.3 million wasted children, that translates to a decline from $0.25 per capita to an even lower $0.11 per capita of domestic expenditure for nutrition within the health sector between 2015 and 2016.
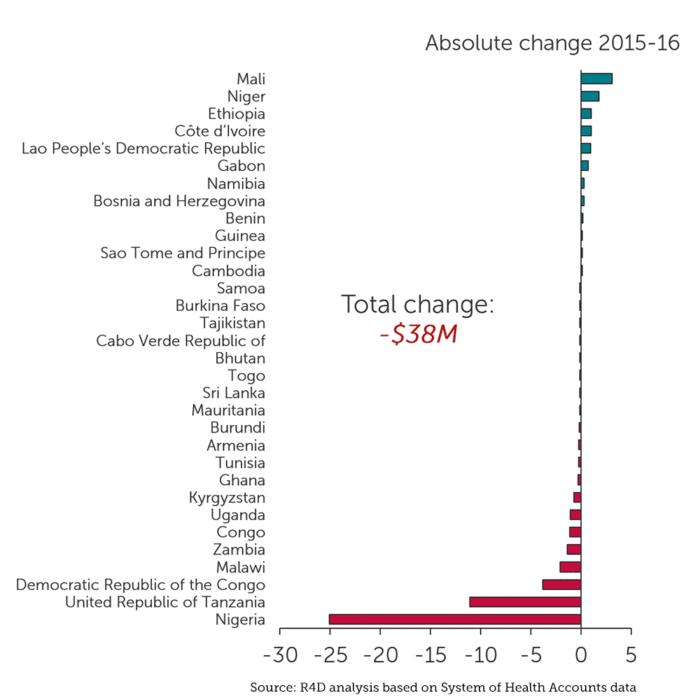
When compounded with our earlier analysis demonstrating that donor financing for nutrition-specific programs may have dropped by 9 percent between 2015 and 2016, the overall financing picture for nutrition is alarming. Nonetheless, there are a few countries where the trend is more optimistic, notably Mali, which increased domestic spending on nutritional deficiencies from $2 million to $5 million between 2015 and 2016 (representing growth of $0.17 per person from an admittedly low base of $0.12 per person). Other positive stories are seen in Niger, Ethiopia and Côte d’Ivoire, all of which saw more than a $1 million increase; among smaller countries, Gabon and São Tomé and Príncipe both more than doubled their spending.
As we look toward Nutrition for Growth in Tokyo as a critical milestone for efforts to combat all forms of malnutrition, it is clear that global efforts must be redoubled to increase funding for critical nutrition programs. This requires strong leadership from nutrition champions in country governments and donor agencies driving enhanced resource mobilization efforts, buttressed by civil society advocacy and accountability efforts, and better leveraging of the private sector. While the overall picture on domestic financing we’ve described is disappointing, we must also grasp any opportunities to learn from successes — looking at countries who have succeeded in raising their funding for nutrition, but also reaching outside the nutrition community for examples of success in mobilizing domestic resources for other health priorities. We need to renew commitment and reinvigorate the conversation on domestic finance for nutrition, but we do not need to reinvent the wheel.
***
NOTE: The SHA framework enables data to be internally consistent and comparable, while also avoiding double counting. However, there are some limitations when considering nutrition. First, the SHA framework captures expenditures within the health sector only and excludes expenditures for multisectoral nutrition programs outside of health. Second, within the health sector, the ‘nutritional deficiencies’ disease code (DIS.3) mainly captures direct nutrition-specific interventions, and it is likely to miss nutrition expenditures delivered through wider maternal and child health programs or infectious disease programs to avoid double counting. For example, a reproductive health program that includes expenditures on micronutrient supplementation would likely be coded as ‘reproductive health’ rather than ‘nutritional deficiencies,’ and it is not standard to split expenditures across both disease codes. Therefore, the data shown here may be an underestimate of total domestic expenditure on nutrition within health that would account for all types of nutrition investment, whether through direct programming or integrated within a wider program.
Photo © Morgana Wingard, USAID


